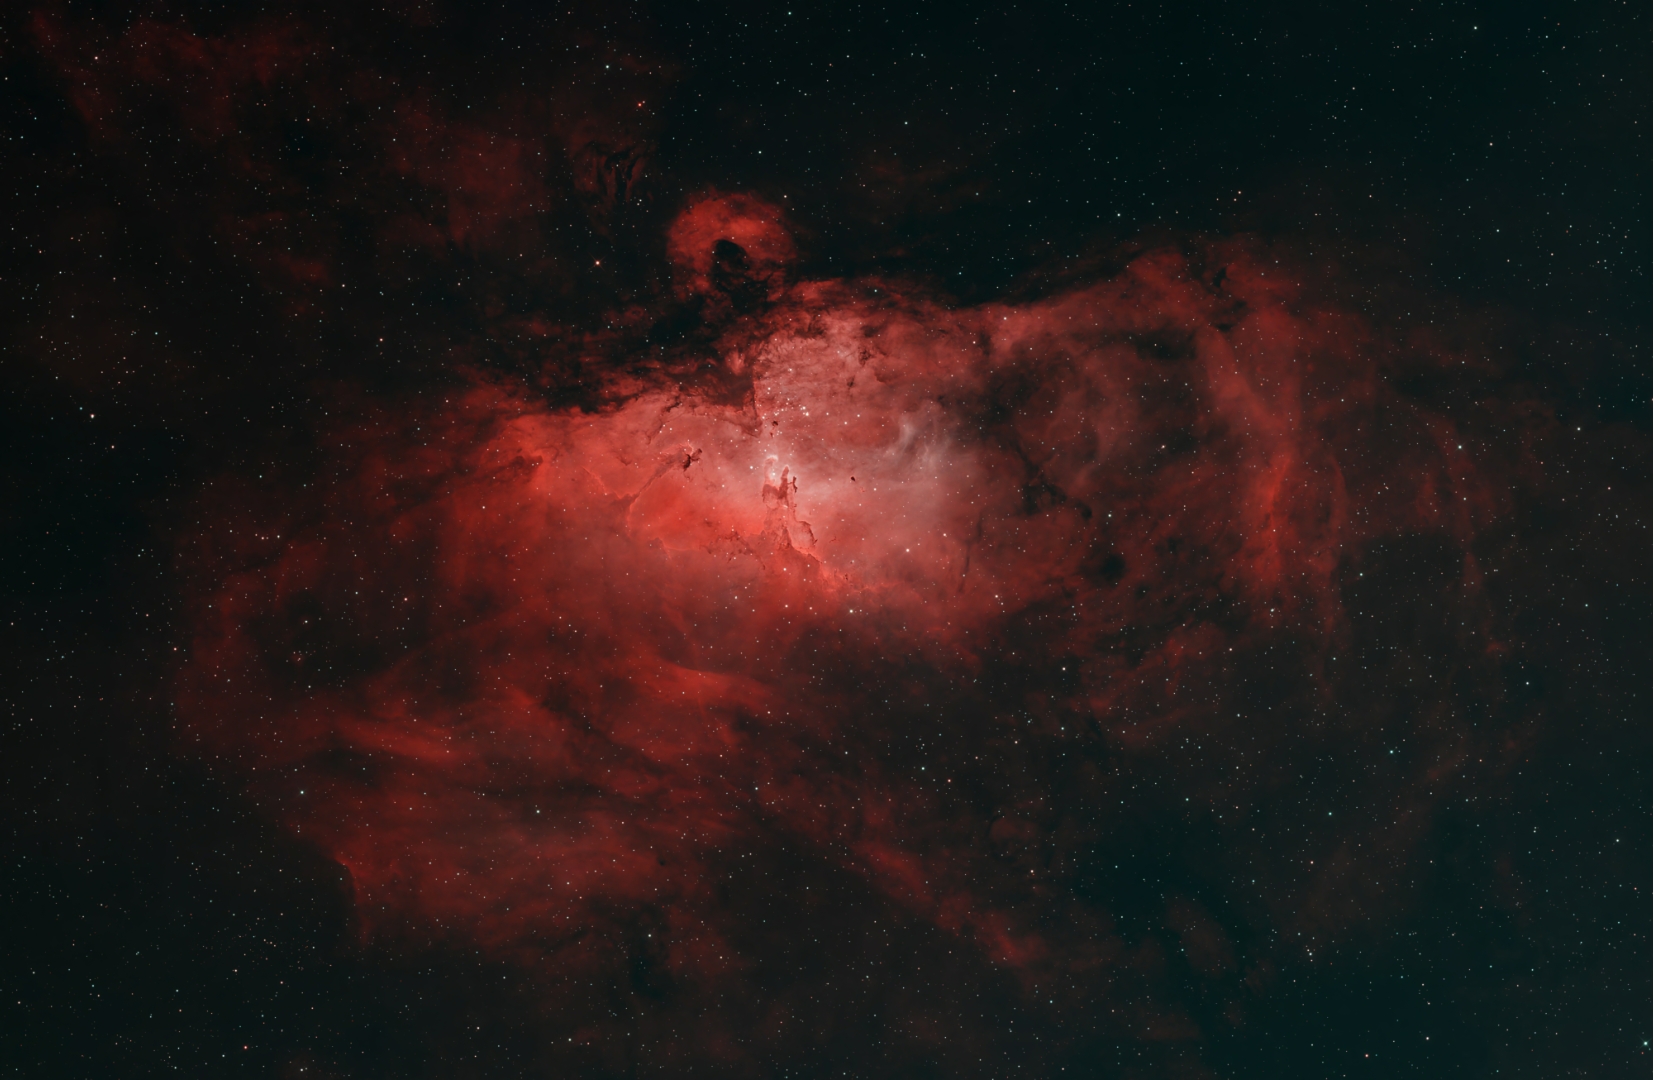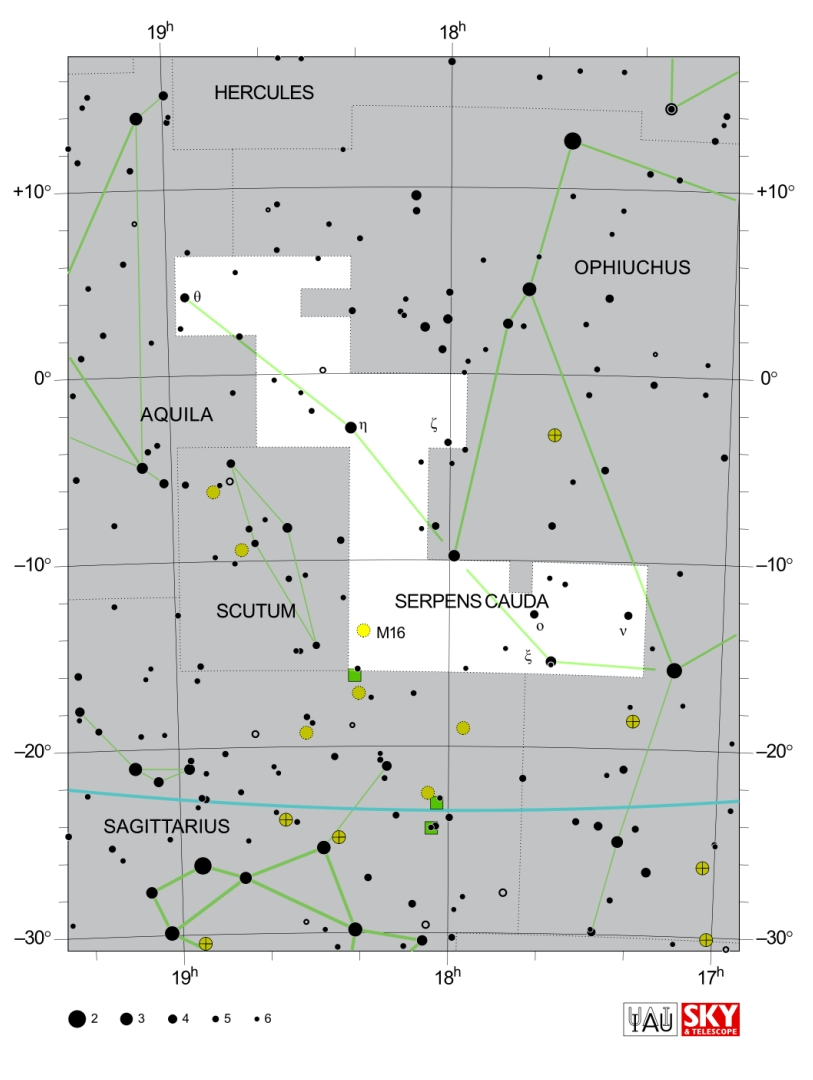
M16 The Eagle Nebula
Object
About 7,000 light-
Image
This image was taken over the nights of the 18th and 21st of July 2026. The image was captured with an OSC camera and processed primarily in PixInsight with plugins. The details are as follows:
Location: Cork city, Ireland (Bortle 7).
Date: 18th and 21st July 2026.
Seeing: Good to fair.
Moon Phase: First Quarter.
Telescope: Sky Watcher N150/750 PDS Newtonian Reflector.
Barlow/Reducer: N/A.
Coma Corrector: Baader Planetarium RCC Rowe I.
Other Optics: N/A.
Camera: ZWO ASi 2600 MC Pro
Filter 1: Optolong L-
Filter 2: N/A..
Controller: ZWO ASiair Pro
Guide Scope: William Optics M-
Guide Camera: ZWO ASi 462 MM.
Guiding Error: 0.56” to 0.8” RMS.
Mount: Sky Watcher EQ6-
Image Processing:
Application 1: N/A
Application 2: Pleiades Astrophoto PixInsight & Plugins.
Application 3: RC Astro BlurXTerminator.
Application 4: RC Astro StarXTerminator.
Application 5: RC Astro NoiseXTerminator.
Image Capture:
Light Frames: 49 x 300 s.
Flat Frames: 60.
Dark Frames: 60 x 300 s.
Bias Frames: 30.
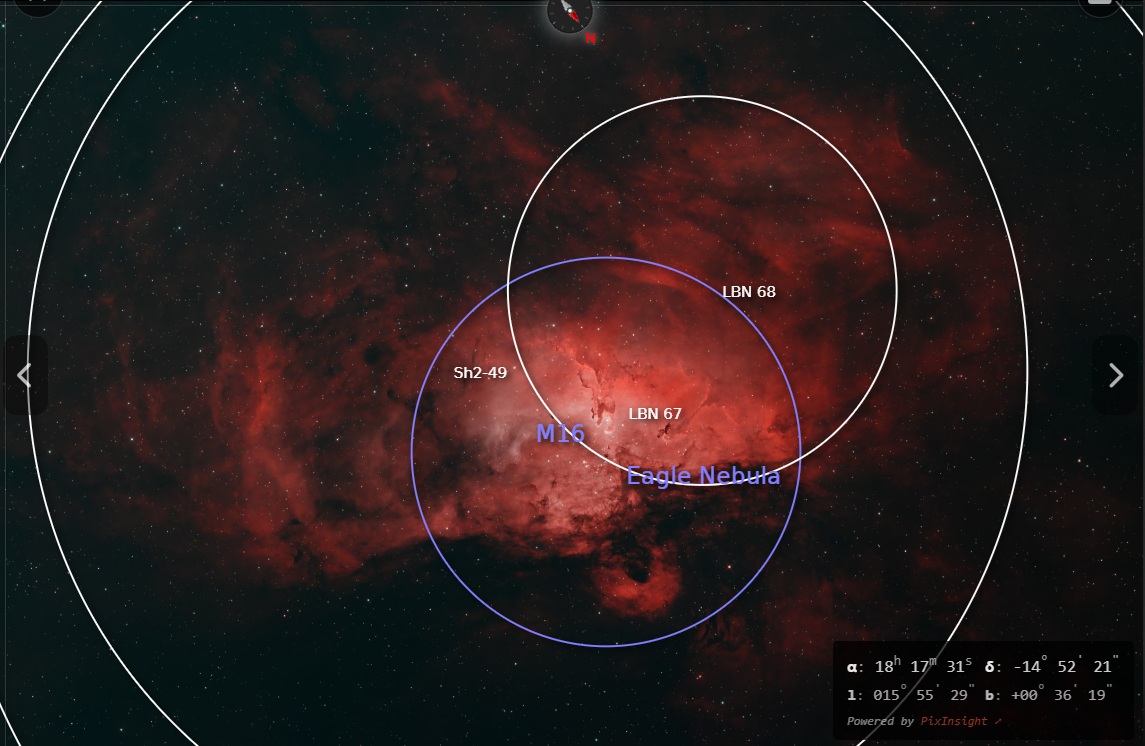
Location Annotated Image
History
The observational history of the Eagle Nebula (Messier 16, or M16) began in 1745–1746,
when Swiss astronomer Jean-
Physics
M16 lies toward the constellation Serpens and contains a young stellar cluster associated with an extended emission nebula. Although “M16” often denotes the entire complex, NGC 6611 specifically identifies the cluster. The Pillars of Creation occupy only a small part of the surrounding nebula. Their prominence in astronomical images should therefore not be confused with dominance over the region’s total star formation. NASA, Messier 16
Distance estimates differ across the literature. Stoop et al. (2023) derived a mean
cluster distance of 1706 ± 7 parsecs from selected Gaia EDR3 members, equivalent
to approximately 5560 light-
ℓ ≈ dθ
Here, ℓ is projected length, d is distance, and θ is angular size in radians. Since one arcsecond equals approximately 1/206265 radians, one arcsecond at the adopted distance corresponds to 0.00827 parsecs, or approximately 1706 astronomical units. Distance choices therefore directly affect inferred physical sizes.
Observations across the electromagnetic spectrum
Different wavelengths probe different components of M16. Visible-
Near-
The James Webb Space Telescope provides complementary infrared views. Its mid-
Ionization and the Origin of Nebular Emission
Hot massive stars emit photons energetic enough to ionize hydrogen. The ionization threshold is:
E = hν ≥ 13.6 eV (2)
Here, E is photon energy, h is Planck’s constant, and ν is frequency. Recombination and subsequent radiative transitions generate hydrogen emission lines, including Hα. Heating associated with photoionization also supports collisionally excited emission from heavier elements. A useful idealized description is the Strömgren sphere. For uniform, pure hydrogen gas in steady ionization equilibrium:
Rₛ = [3Q_H / (4πα_B nₑ nₚ)]^(1/3)
Rs is the equilibrium ionized radius, Q_H is the emission rate of hydrogen-
The Pillars as Evolving Cloud Structures
The pillars are dense remnants exposed to radiation from nearby massive stars. Their illuminated surfaces lose material while more shielded interiors can remain molecular. McLeod et al. (2015) used the Multi Unit Spectroscopic Explorer on the Very Large Telescope to investigate this process. They measured layered ionization structure and gas velocities consistent with photoevaporative flows. Their observations also identified a bipolar outflow near the middle pillar’s tip, suggesting an embedded protostellar driving source. These findings connect cloud erosion and ongoing stellar activity within the same environment. McLeod et al. (2015).
A simple estimate of mass loss through an illuminated surface is:
Ṁ ≈ Aρᵢvᵢ
Here, Ṁ is the positive mass-
A corresponding dispersal timescale is:
t_evap ≈ M / Ṁ
Using an approximate pillar mass of 200 solar masses and the published mass-
Gravitational Collapse Versus Erosion
Whether an individual condensation forms a star depends partly on whether gravity
can overcome internal support before substantial material is removed. For a uniform,
pressureless sphere, the gravitational free-
t_ff = √[3π / (32Gρ)]
G is the gravitational constant and ρ is mass density. For an illustrative molecular hydrogen number density n(H2) = 10⁴ cm⁻³, including helium through ρ ≈ 2.8m_H n(H2), the density is approximately 4.7 × 10⁻²⁰ g cm⁻³. The equation then gives: t_ff ≈ 0.31 million years.
At n(H2) = 10⁵ cm⁻³, the same calculation gives approximately 0.10 million years.
These are hypothetical dense-
M_J = [π^(5/2) / 6] × cs³ / [G^(3/2)ρ^(1/2)]
The isothermal sound speed is:
Cs = √[k_B T / (μm_H)]
Here, k_B (or k) is Boltzmann’s constant, T is temperature, and μm_H is the mean mass per free gas particle. The dependence:
M_J proportional to T^(3/2)ρ^(−1/2)
(sorry, can find a symbol for “proportional to”)
captures two competing effects: heating raises the characteristic collapse threshold, whereas compression lowers it. These simplified models omit magnetic fields, turbulence, rotation, and external pressure. Moreover, a core’s collapse time must be compared with its own erosion time, not automatically with the dispersal time of the entire pillar. The calculations establish physical plausibility, not a prediction that every dense knot will become a star.
Does Stellar Feedback Trigger Star Formation?
M16 illustrates a central causal difficulty. Young stars near an ionization front may have formed because external pressure compressed their parent gas. Alternatively, their collapse may have begun before irradiation exposed or reshaped the cloud. Infrared detections establish that young objects are present but cannot, by themselves, distinguish these histories. ESO, The Eagle’s EGGs.
A stronger test would combine stellar ages, gas velocities, density structure, and estimates of when the radiation front arrived. Simulations should then compare otherwise similar clouds with and without feedback. Triggering requires evidence that feedback caused or accelerated collapse beyond what would have occurred independently.
A stronger test would combine stellar ages, gas velocities, density structure, and estimates of when the radiation front arrived. Simulations should then compare otherwise similar clouds with and without feedback. Triggering requires evidence that feedback caused or accelerated collapse beyond what would have occurred independently. Feedback may also have different effects at different scales. Compression can assist collapse in one condensation while mass loss reduces the surrounding supply available for future accretion. Therefore, local star formation and overall cloud dispersal can occur simultaneously without implying that irradiation increases the total stellar yield.
References
McCaughrean, M. J., and Andersen, M. (2002). “The Eagle’s EGGs: Fertile or sterile?” Astronomy & Astrophysics, 389, 513–518.
McLeod, A. F., et al. (2015). “The Pillars of Creation revisited with MUSE: gas kinematics
and high-
Stoop, M., et al. (2023). “The early evolution of young massive clusters: The kinematic history of NGC 6611/M16.” Astronomy & Astrophysics, 670, A108.